


In a city, once predominantly Black and continually Black governed, it’s discomforting that race and economic disparities still prevail. Covid has shown that there are still pockets in the city that suffer disproportionally. These underserved communities bear the brunt of the Covid pandemic. The numbers tell a story of a city that continues to struggle to meet the needs of its underserved. It’s not a coincidence that neighborhoods with the highest Black populations and lowest incomes have the highest Covid cases and deaths.
Income and Race
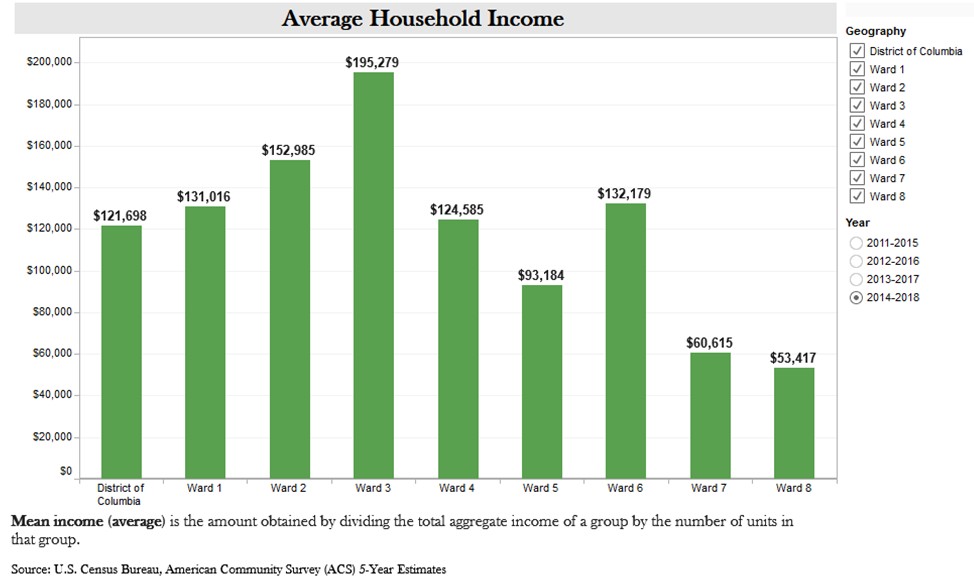
There are two foundational components of the following charts- income and race. The first chart shows the distribution of income in D.C. by Ward. It’s clear to see that Wards, 5, 7, and 8 have the lowest average incomes. It’s not surprising then that the average income tracks to the racial demographics for each of those wards. This belays the fact that, unlike prior years, D.C. is more racially balanced than previous years. The latest census shows a 48% to 47% split between whites and Blacks. However, Blacks continue to reside in underserved pockets throughout the city.
In and of themselves these are but numbers. Mere statistics. The proof is in the pudding when we look at the correlation of these numbers to Covid cases and deaths. It’s one thing to indicate that the whiter the community the higher the income. It’s another thing to say the whiter the community to greater access to city services, prosperity, and health.

COVID by Ward and Race
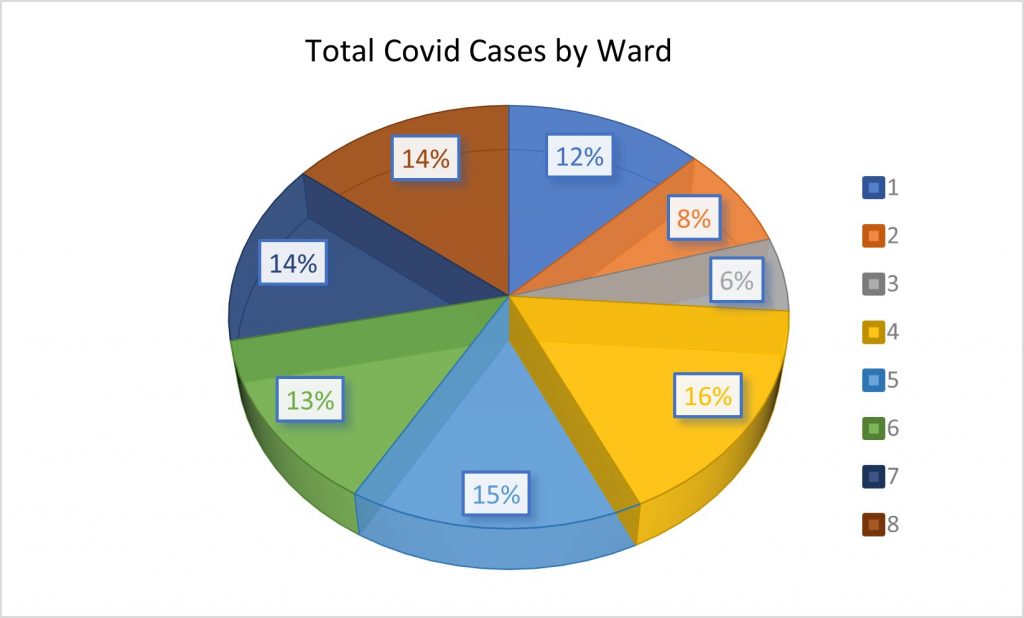
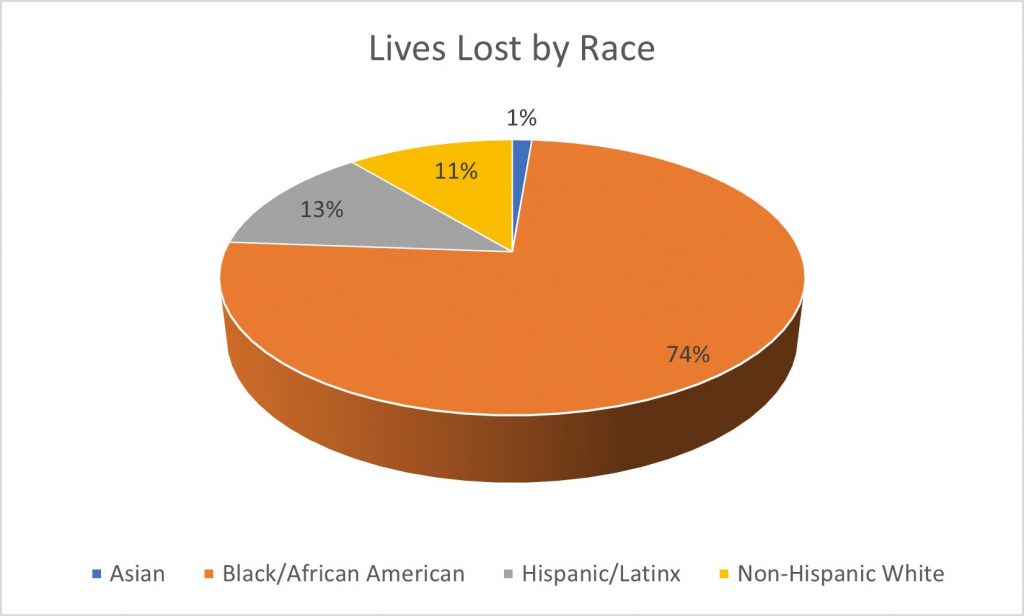
I applaud the District for a very comprehensive Coronavirus website. The site is filled with information on vaccination locations, food centers, testing, health guidance, etc. I encourage everyone to visit it for further information. However, the Data section exposes the realities of Covid’s impact by race as seen in the charts below. What’s particularly distressing is the impact on our seniors which predominate our underserved Wards as well.
It only stands to reason that matching income, to Ward, will lead you to the next undeniable conclusion. Blacks make up the most total cases and deaths.


Summing It All Up
By and large, the District has been praised for its handling of the pandemic. Aside from the controversies surrounding our children returning to the classrooms, which many cities have struggled with, the press has been positive. Our mayor is gaining national prominence for her handling of Covid and the Black Lives Matter protests during the summer. However, that prominence can’t be on the backs of the citizens of the District.
A Democrat Congress, Senate, and White House are increasing the cries for DC Statehood. There is an underlying sentiment in the city that statehood will come when the demographics are right. Let’s hope that is not true. We should be fighting to ensure income growth and prosperity for all 8 wards. Give all residents the opportunity to enjoy the expanding services of the city. DC residents hope that statehood doesn’t hinge on the displacement and purging of low income and Black citizens to create the demographic for statehood.
***
Mean (Average) Household Income
Race/ethnicity of total population by ward in District of Columbia
https://dcdataviz.dc.gov/node/1368981


Add comment